
Horse SAA Rechecks: When Two Serum Amyloid A Results Can Be Compared
Two equine serum amyloid A results form a trend only when method, tube type, draw timing and sample handling match. A five-row ledger shows what to record.

The Two SAA Numbers That Do Not Belong in One Trend
Consider a scenario from a manufacturer-authored teaching article on the Stablelab stall-side reader. A horse with cellulitis read 485 µg/mL of serum amyloid A (SAA) at the first visit. Four days after antimicrobial therapy was started, the horse looked clearly better, yet the recheck read 850 µg/mL. To an owner, a number that nearly doubled feels like proof that treatment failed. The horse standing in the stall suggests otherwise.
The manufacturer's explanation is that the first value was drawn early on the rising side of the curve, and the peak, which the author estimates was likely in the 2,000–3,000 µg/mL range, was missed during the four-day gap; 850 µg/mL was already on the way down. That is a plausible reading, but it is an inference from two points. The same pair of numbers could also reflect a change of assay, a different tube, a delayed sample, or a non-infectious event between draws. SAA can begin rising about 6 hours after an inflammatory stimulus, can reach up to about 1,000-fold its starting concentration within 24–48 hours, and drops quickly once inflammation resolves, so two values taken days apart can sit almost anywhere on that curve.
What SAA Measures — and What It Does Not
Serum amyloid A is a small acute-phase apoprotein made mainly in the liver; it circulates bound to high-density lipoproteins, and interleukin-6 released after local tissue stimulation is one of the signals that drives hepatic production. In horses it is the major acute-phase protein, described in the 2019 Equine Veterinary Journal review by Witkowska-Piłaszewicz and colleagues as the most sensitive indicator of the acute-phase response in this species. Forms of SAA are also made outside the liver, in tissues such as the gut lining, mammary gland and airways, which is one reason the biology is broader than a single blood number.
In healthy horses, blood SAA has generally been reported from <0.5 to 20 mg/L; the review attributes that wide range to individual immune responses and probably to measurement method. Cornell's laboratory gives a reported interval of <5 to 20 µg/mL for its assay. After an inflammatory trigger such as infection or tissue injury, concentrations can rise from about 6 hours and reach up to about 1,000-fold the initial value within 24–48 hours; when inflammation resolves, the review reports a drop within about 12 hours. The 2022 method-comparison paper by Kiemle and colleagues cites a short half-life of 30–120 minutes, which is why SAA tracks the current inflammatory drive rather than past events. The manufacturer article summarizes the practical pattern as a peak within 24–48 hours and a fall of about 50% every 24 hours once the stimulus resolves. Treat that as vendor guidance on the shape of the curve, not a measured rate for every horse.
Manufacturer content sometimes simplifies this further. The same Stablelab article states that a normal, healthy adult horse has an SAA level of 0 µg/mL, that SAA has been shown to be "30 times more sensitive than a thermometer," and that noninfectious inflammatory conditions rarely elevate SAA at all. None of those statements matches the way the peer-reviewed review frames the marker: healthy horses generally fall between <0.5 and 20 mg/L depending on method, and the review lists several non-infectious triggers, covered below. The review's practical advice is more useful for a ledger: interpret SAA against the horse's own value measured when healthy, so that a moderate rise can be judged against that individual baseline.
Method First: Same Device, Same Laboratory, Same Scale
The first requirement of any serial comparison is the same method. In equine practice, SAA is measured either on a handheld point-of-care reader beside the horse or on an automated turbidimetric immunoassay in a diagnostic laboratory. Results from the two cannot be used interchangeably on one patient's trend line.
In the 2022 Journal of Veterinary Diagnostic Investigation study, Kiemle and colleagues compared the Stablelab point-of-care assay with two laboratory turbidimetric immunoassays from Eiken Chemical: LZ-SAA, designed for human SAA (TIA-Hum), and VET-SAA, designed for veterinary use (TIA-Vet). Across 49 stored equine serum samples, the medians were 1,093 mg/L on the point-of-care reader, 752 mg/L on TIA-Hum and 578 mg/L on TIA-Vet. Bland–Altman analysis showed a proportional bias of −56.7% between the point-of-care assay and TIA-Hum and −80.9% between the point-of-care assay and TIA-Vet; even the two laboratory assays differed from each other by −28.2%.
Correlation between the point-of-care reader and each laboratory assay was only fair (rs = 0.77 and 0.69), and the absolute bias grew as SAA concentrations rose. In practical terms, a sample that reads about 1,000 on a stall-side reader could read far lower on a laboratory analyzer the same day. A switch from one method to the other between visits can therefore manufacture an apparent improvement or hide a real change. The authors' conclusion was direct: follow-up examinations of a patient should be made with the same SAA assay type.
Precision differed as well. In the same study the turbidimetric assays generally had coefficients of variation (CV) below 12%, while the point-of-care assay had intra-assay CVs of 16.1–30% and inter-assay CVs of 19.8–35.5%. With a precision window that wide, a modest shift on a stall-side reader, such as 200 to 260 µg/mL, can come from analytical imprecision rather than a real change in the horse.
Two further limits matter at the extremes and with poor-quality samples. The point-of-care assay showed a hook effect above about 3,000 mg/L, which means very high samples can read falsely low. In interference testing, added bilirubin and hemoglobin biased point-of-care and TIA-Vet results downward (−16.6% to −45.6%), and added lipid biased them upward (35.9% to 77.4%), so a hemolyzed, icteric or lipemic sample is worth noting in the record. Laboratories also have reporting ceilings: Cornell lists an upper reported limit of 2,500 µg/mL for its assay, so a very high laboratory value may be a ceiling rather than an exact number.
Units cause needless confusion. Cornell's announcement reports SAA in µg/mL, while the peer-reviewed papers report mg/L. The two units are numerically identical (1 µg/mL = 1 mg/L). The literature's <0.5–20 mg/L and Cornell's <5–20 µg/mL differ because of method and Cornell's stated lower limit of detection (<5 µg/mL), not because of the unit.
| Assay (Kiemle et al. 2022) | Where it runs | Median on the same 49 sera | Reported precision and limits |
|---|---|---|---|
| Stablelab point-of-care reader | Stall-side handheld reader | 1,093 mg/L | Intra-assay CV 16.1–30%; inter-assay CV 19.8–35.5%; hook effect above ~3,000 mg/L; bilirubin/hemoglobin bias down, lipid bias up |
| LZ-SAA turbidimetric assay (TIA-Hum) | Laboratory analyzer | 752 mg/L (bias vs point-of-care −56.7%) | CV generally <12%; designed for human SAA; 5–500 mg/L working range before dilution |
| VET-SAA turbidimetric assay (TIA-Vet) | Laboratory analyzer | 578 mg/L (bias vs point-of-care −80.9%) | CV generally <12%; designed for veterinary use; 5–200 mg/L working range before dilution; bilirubin/hemoglobin bias down, lipid bias up |
Specimen Second: Which Tube Fed the Analyzer
Even on the same analyzer, an SAA trend is weaker if blood went into different tube types on different visits, because the laboratory's own accuracy statements are tied to specimen type.
Cornell AHDC's Clinical Pathology Laboratory lists serum as its preferred sample for SAA, says heparin plasma is okay as well, and warns that EDTA plasma may yield inaccurate results. That is one laboratory's rule for its own assay; other laboratories and point-of-care devices may state different requirements, which is why the tube belongs in the record rather than in anyone's memory.
Cornell does not explain why EDTA plasma may be inaccurate, and this guide does not guess. The practical point is simpler: if the tube type changed between two draws, the comparison is weaker, and the veterinarian should know that before reading the second number as a trend. The Kiemle study adds a related caution. Its authors used only serum and a single cartridge batch because an earlier evaluation of the point-of-care assay had reported inter-assay CVs as high as 45.5%, attributed to mixing serum and plasma samples and to batch-to-batch differences.
Specimen rules also need to be read per order rather than assumed. On Cornell AHDC's own equine plans and panels page, the SAA VET specimen line is worded differently from plan to plan:
Equine Basic Workup: "1ml serum."
Equine Fever of Unknown Origin plans (acute and chronic): "Serum."
Equine Chronic Ill Thrift/Weight Loss Plan: "1ml serum or plasma."
Foal diarrhea/septicemia, foal joint ill and newborn-foal wellness plans: "Serum (separated)."
Adult/performance wellness profile: "Serum (separated, cooled, protected from light)."
For contrast, ACTH Baseline on the same page requires separated EDTA plasma frozen within 4 hours of obtaining the sample, a very different tube and clock from SAA.
When an ill horse is being tracked, ask that each result record which tube was used. If day one used serum and day three used heparin plasma, any shift in SAA has to be read with that change in mind.
Timing Third: Where the Horse Was on the Curve
The biological response curve is what makes serial values readable. The published kinetics can be described as four broad stages; exact timing varies with the horse and the cause:
Early hours: SAA can begin rising as early as about 6 hours after infection or tissue injury (the Kiemle paper describes a rise over 6–12 hours). A normal value drawn within hours of a new problem cannot exclude inflammation that has not yet reached the blood.
Peak window: concentrations can reach up to about 1,000-fold the starting value within 24–48 hours; the manufacturer article likewise places the peak within 24–48 hours.
Plateau while the stimulus persists: the manufacturer article says SAA stays elevated until the systemic stimulus resolves, whether through treatment or the horse's own immune response.
Decline: once inflammation resolves, the review reports a drop within about 12 hours, and the manufacturer describes a fall of about 50% every 24 hours. Post-surgical series show the time scale: after minor surgery without post-operative infection, the review describes values of roughly 100–400 mg/L peaking around day 3, and after laryngoplasty and ventriculectomy, peaks of 50–150 mg/L at day 2 with return to normal by day 7.
Apply that to the opening pair. If the 485 µg/mL draw was taken early on the rising limb, the concentration could have kept climbing for a day or more, peaked, and then begun to fall once treatment took effect. A peak in the 2,000–3,000 µg/mL range, the manufacturer author's estimate, halving roughly every 24 hours could plausibly be in the high hundreds by day four. Under that reading, 850 µg/mL is on the way down. The arithmetic holds only if both draws used the same reader, the same specimen and prompt handling, and nothing else inflamed the horse in between. Otherwise the pair cannot carry that conclusion, and only the veterinarian, with the examination in front of them, can decide which reading fits.
flowchart TD
  A["Inflammatory trigger"] --> B["Rise: from about 6 h"]
  B --> C["Peak window: 24-48 h, up to about 1,000-fold baseline"]
  C --> D["Stays high while the stimulus persists"]
  D --> E["Decline once resolved: about 50% per 24 h in manufacturer guidance"]
  G["Draw 1: early, 485 µg/mL"] -.-> B
  H["Draw 2: day 4, 850 µg/mL"] -.-> E
H -.-> I["Higher than draw 1 but possibly falling: judge only with same method, tube and handling"]To avoid the missed-peak trap, the manufacturer article advises running an additional test every 24–48 hours to follow SAA down to normal. That cadence is vendor guidance rather than a consensus guideline, and whether repeated testing is worthwhile for a given horse is the veterinarian's call. The review makes a related point from the clinical literature: serial measurement is likely to be more informative than a single value at admission, for example in colic. For the record, the lesson is that a four- or five-day gap leaves the shape of the curve unknown.
Handling Fourth: What Happens After the Draw
Once blood is collected, a second clock starts that has nothing to do with the horse's own clearance of SAA.
Cornell's announcement reports that SAA values drop up to 5% within 24 hours and up to 10% by 48 hours of storage, whether at room temperature or refrigerated, so samples should be run as soon as possible. Storage delay biases the measured value downward.
How much that matters depends on the starting concentration. Cornell notes that storage loss may pull mildly increased values back within the reference interval but should not affect the interpretation of high values (>50 µg/mL). As an illustration, a horse reading 1,500 µg/mL that loses 10% in transit still reads 1,350 µg/mL and remains clearly inflamed. A convalescent sample with a true value of 22 µg/mL that loses 10% reads 19.8 µg/mL, slipping just under the 20 µg/mL upper end of the reported interval and looking more resolved than it is.
Cornell's handling advice is short: run the sample as soon as possible, and if submission will be delayed, freeze it in a dedicated freezer and submit it on dry ice. Several of Cornell's equine plans add a note to ship chilled. Clotting, centrifugation and shipping steps belong to the clinic's and the laboratory's own instructions, and owners should not try to collect or process samples themselves. For context on long-term storage, the Kiemle study found equine serum SAA stable over a median of 2.5 years at −80 °C, but that is research-freezer storage, not a barn refrigerator or an overnight courier.
The Ledger: Five Rows to Record With Every SAA Draw
To make serial SAA results comparable, ask that every draw be recorded with the same five rows of context beside the number. This is a record to keep and discuss with the veterinarian, not a treatment guide:
Row 1: Date, clock time and elapsed time. The date and time of collection, plus hours since the first observed sign (for example the first fever, colic signs or surgery) and since any treatment started.
Row 2: Assay method, instrument, laboratory and units. Stall-side reader or laboratory turbidimetric assay, the device or laboratory used, and the units (remember µg/mL = mg/L).
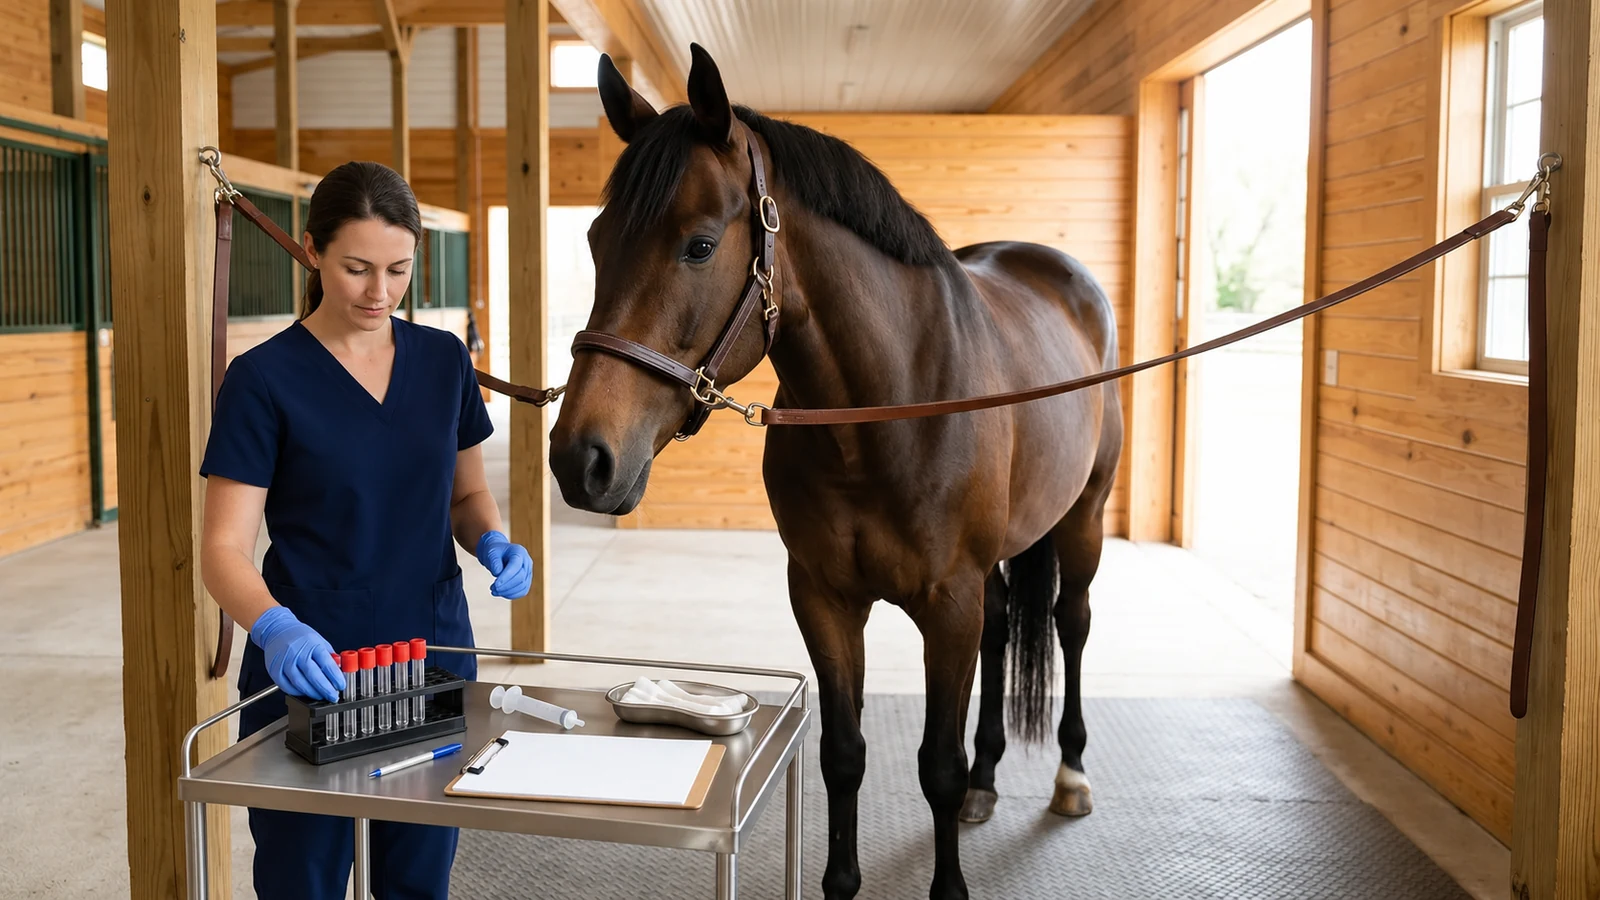
Row 3: Tube and specimen. Serum (plain red-top or serum separator tube) or heparin plasma, and whether it was separated.
Row 4: Handling and storage. Time from draw to analysis or separation, storage temperature (room temperature, refrigerated, frozen), transit time, and any note of hemolysis, jaundiced or lipemic serum.
Row 5: Horse status and confounding events. Rectal temperature, appetite and demeanor, current medications, and recent non-infectious events such as vaccination, trailer transport, strenuous work, competition, surgery or foaling.
The example below is hypothetical. It shows how the ledger reads for one horse tested three times on the same reader at the 24–48-hour spacing the manufacturer suggests:
| Ledger row | Draw 1 (first visit) | Draw 2 (48-hour recheck) | Draw 3 (96-hour recheck) |
|---|---|---|---|
| 1. Date, time and timeline | Day 0, 08:30 (about 8 h after fever noticed) | Day 2, 08:45 (about 56 h) | Day 4, 09:00 (about 104 h) |
| 2. Method, laboratory and units | Same stall-side reader (µg/mL) | Same stall-side reader (µg/mL) | Same stall-side reader (µg/mL) |
| 3. Tube and specimen | Plain red-top tube (serum) | Plain red-top tube (serum) | Plain red-top tube (serum) |
| 4. Handling and storage | Run stall-side within the hour | Run stall-side within the hour | Run stall-side within the hour |
| 5. Horse status and events | 103.4°F; nasal discharge; no recent travel or vaccination | 100.8°F; appetite improving; on veterinarian's treatment plan | 99.8°F; normal appetite; treatment plan continuing |
| Recorded SAA | 485 µg/mL (early, likely still rising) | 1,850 µg/mL (near or past the peak; one value cannot tell) | 470 µg/mL (roughly a 50% fall per 24 h from draw 2) |
Laid out this way, the comparison is easier to defend. Method, tube and handling are identical across the three draws, so the numbers can be read as one series. The rise from 485 to 1,850 µg/mL fits a first draw taken before the peak; the fall to 470 µg/mL at 96 hours is consistent with the decline the manufacturer describes and agrees with the improving temperature and appetite. The third value is still far above the reference interval, though. A falling trend is encouraging context for the veterinarian, not a signal that the horse has finished treatment or is cleared for work.
What a Trend Can — and Cannot — Say
Even with a flawless comparison ledger, equine practitioners must recognize the biological boundaries of SAA testing. A serial trend provides valuable diagnostic context, but it has specific clinical blind spots.
First, a normal SAA does not exclude significant infection. In a study cited by the Equine Veterinary Journal review, foals with bronchopneumonia on farms with endemic Rhodococcus equi infection did not necessarily mount an SAA response: 15 of 54 pneumonic foals (28%) had SAA below 5 mg/L, and SAA had low sensitivity and specificity for detecting R. equi pneumonia. In those foals SAA did not correlate with radiographic or ultrasonographic severity, and weekly SAA testing was not an accurate marker of infection. A low value cannot be used to rule out pulmonary disease.
Second, localized or barrier-protected inflammation may barely register in blood SAA. The review notes that foals with umbilical abscesses had low SAA, explained by the isolated character of the inflammation, and that horses with ocular conditions such as uveitis and keratitis showed no increase in plasma SAA, consistent with the blood–ocular barrier. Real local disease can coexist with a normal blood SAA value.
Third, non-infectious events raise SAA. The review lists increases after surgery, parturition, vaccination, strenuous exertion and transportation, and the magnitudes are not trivial: SAA rose more than 10-fold after long-distance endurance rides, 2–4-fold after moderate rides or strenuous training in inexperienced horses, and about 7-fold after flat racing, returning to baseline within 2 days. In mares, values of 0–1,615 mg/L were recorded 36 hours after foaling, returning to basal levels within 60 hours. A horse whose SAA rises from 10 to 180 µg/mL after a long haul or a hard training week, without fever or other signs, may be reflecting its schedule rather than an infection. That is something the veterinarian weighs before any treatment decision, which is why Row 5 of the ledger exists.
Finally, there are no equine-specific analytical quality requirements for SAA. Kiemle and colleagues had to judge their assays against CV targets and a 37% total allowable error derived from human SAA biologic variation. Those borrowed targets are useful benchmarks, but they are another reason to treat SAA values as context for clinical judgment rather than as rigid cutoffs.
SAA Beside the Paper Trail: Travel, Purchase, and Official Tests
A final area of confusion involves the regulatory standing of SAA. Because stall-side SAA testing has become ubiquitous in equine sports and sales barns, horse owners sometimes ask whether an SAA reading can be included on official health certificates or used to clear horses for interstate transport.
In the United States, official disease testing sits in a separate regulatory framework. Under 9 CFR § 71.22, state, university and private laboratories must obtain APHIS approval to conduct official testing for the diseases covered by the interstate-movement regulations, which include equine infectious anemia (EIA, the Coggins test). Approved laboratories must operate under a quality system acceptable to APHIS, use APHIS-approved assay methods, and have testing personnel who pass APHIS-administered proficiency tests. Under 9 CFR § 75.4, a horse that tests positive on an official test (a reactor) may move interstate only when officially identified, accompanied by a certificate, and moving to slaughter, a diagnostic or research facility, or its home farm under quarantine.
SAA is a clinical monitoring marker and is not part of that official-testing framework. It is not the EIA test, and a stall-side SAA value cannot substitute for whatever official tests a destination, event or buyer requires. For movement paperwork or pre-purchase questions, see our guide to Coggins testing requirements and interstate EIA travel rules. SAA records belong in the horse's medical chart, alongside other results that depend on matching methods and timing, such as seasonal ACTH testing for equine PPID, fecal egg count reduction tests (FECRT) for parasite control, oral sugar testing for metabolic syndrome, and pre-analytical sample handling for blood ammonia.
Questions to Take to Your Veterinarian
When reviewing serial SAA results with your horse's veterinarian, these five questions help show whether two numbers can fairly be read as a trend:
Were both samples tested on the same method? Confirm whether both used the same stall-side reader or whether one went to a laboratory turbidimetric analyzer.
Was the same tube type used for both draws? Ask whether both were serum, or whether one was heparin or EDTA plasma.
Where was the horse on the response curve? Ask whether the first sample could have been drawn on the rising side, before an unmeasured peak.
How quickly was each sample run, and how was it stored? Ask whether transit delays or storage could have lowered a value.
Could recent non-infectious events explain the numbers? Mention vaccinations, hard work, competition, long trailer trips, surgery or foaling in the days before the draw.
Sources
Witkowska-Piłaszewicz OD, et al. Serum amyloid A in equine health and disease — Equine Veterinary Journal 2019;51(3):293–298. Peer-reviewed review of SAA kinetics, healthy ranges, non-infectious triggers, and limits in localized and foal infections.
Kiemle J, et al. Comparison of a point-of-care serum amyloid A analyzer frequently used in equine practice with 2 turbidimetric immunoassays — Journal of Veterinary Diagnostic Investigation 2022;34(1):42–53. Method-comparison study of the Stablelab point-of-care assay versus two turbidimetric immunoassays: bias, CVs, hook effect, interferences and storage stability.
Cornell AHDC: Now Offering Serum Amyloid A (SAA) Testing — Cornell AHDC Clinical Pathology Laboratory announcement (2018): preferred sample (serum; heparin plasma okay; EDTA plasma may yield inaccurate results), reported interval, reporting limits and storage stability.
Cornell AHDC: Equine Diagnostic Plans and Panels — Cornell AHDC test directory listing the SAA VET specimen for each equine plan, alongside ACTH Baseline requirements.
Understanding the Typical Serum Amyloid A Response Curve: The Key to Interpreting Stablelab Results (AAEVT) — Manufacturer-authored (Zoetis) article by Amy Poulin Braim, republished by AAEVT; used here for the response-curve framing, retesting suggestion and worked example, with its promotional claims flagged.
Title 9, Code of Federal Regulations, Section 71.22: Approval of laboratories to conduct official testing — Electronic Code of Federal Regulations via the Legal Information Institute: APHIS approval of laboratories for official testing.
Title 9, Code of Federal Regulations, Section 75.4: Interstate movement of equine infectious anemia reactors — Electronic Code of Federal Regulations via the Legal Information Institute: conditions for interstate movement of EIA reactors.